
Performance Modeling for Rod-Pump Systems
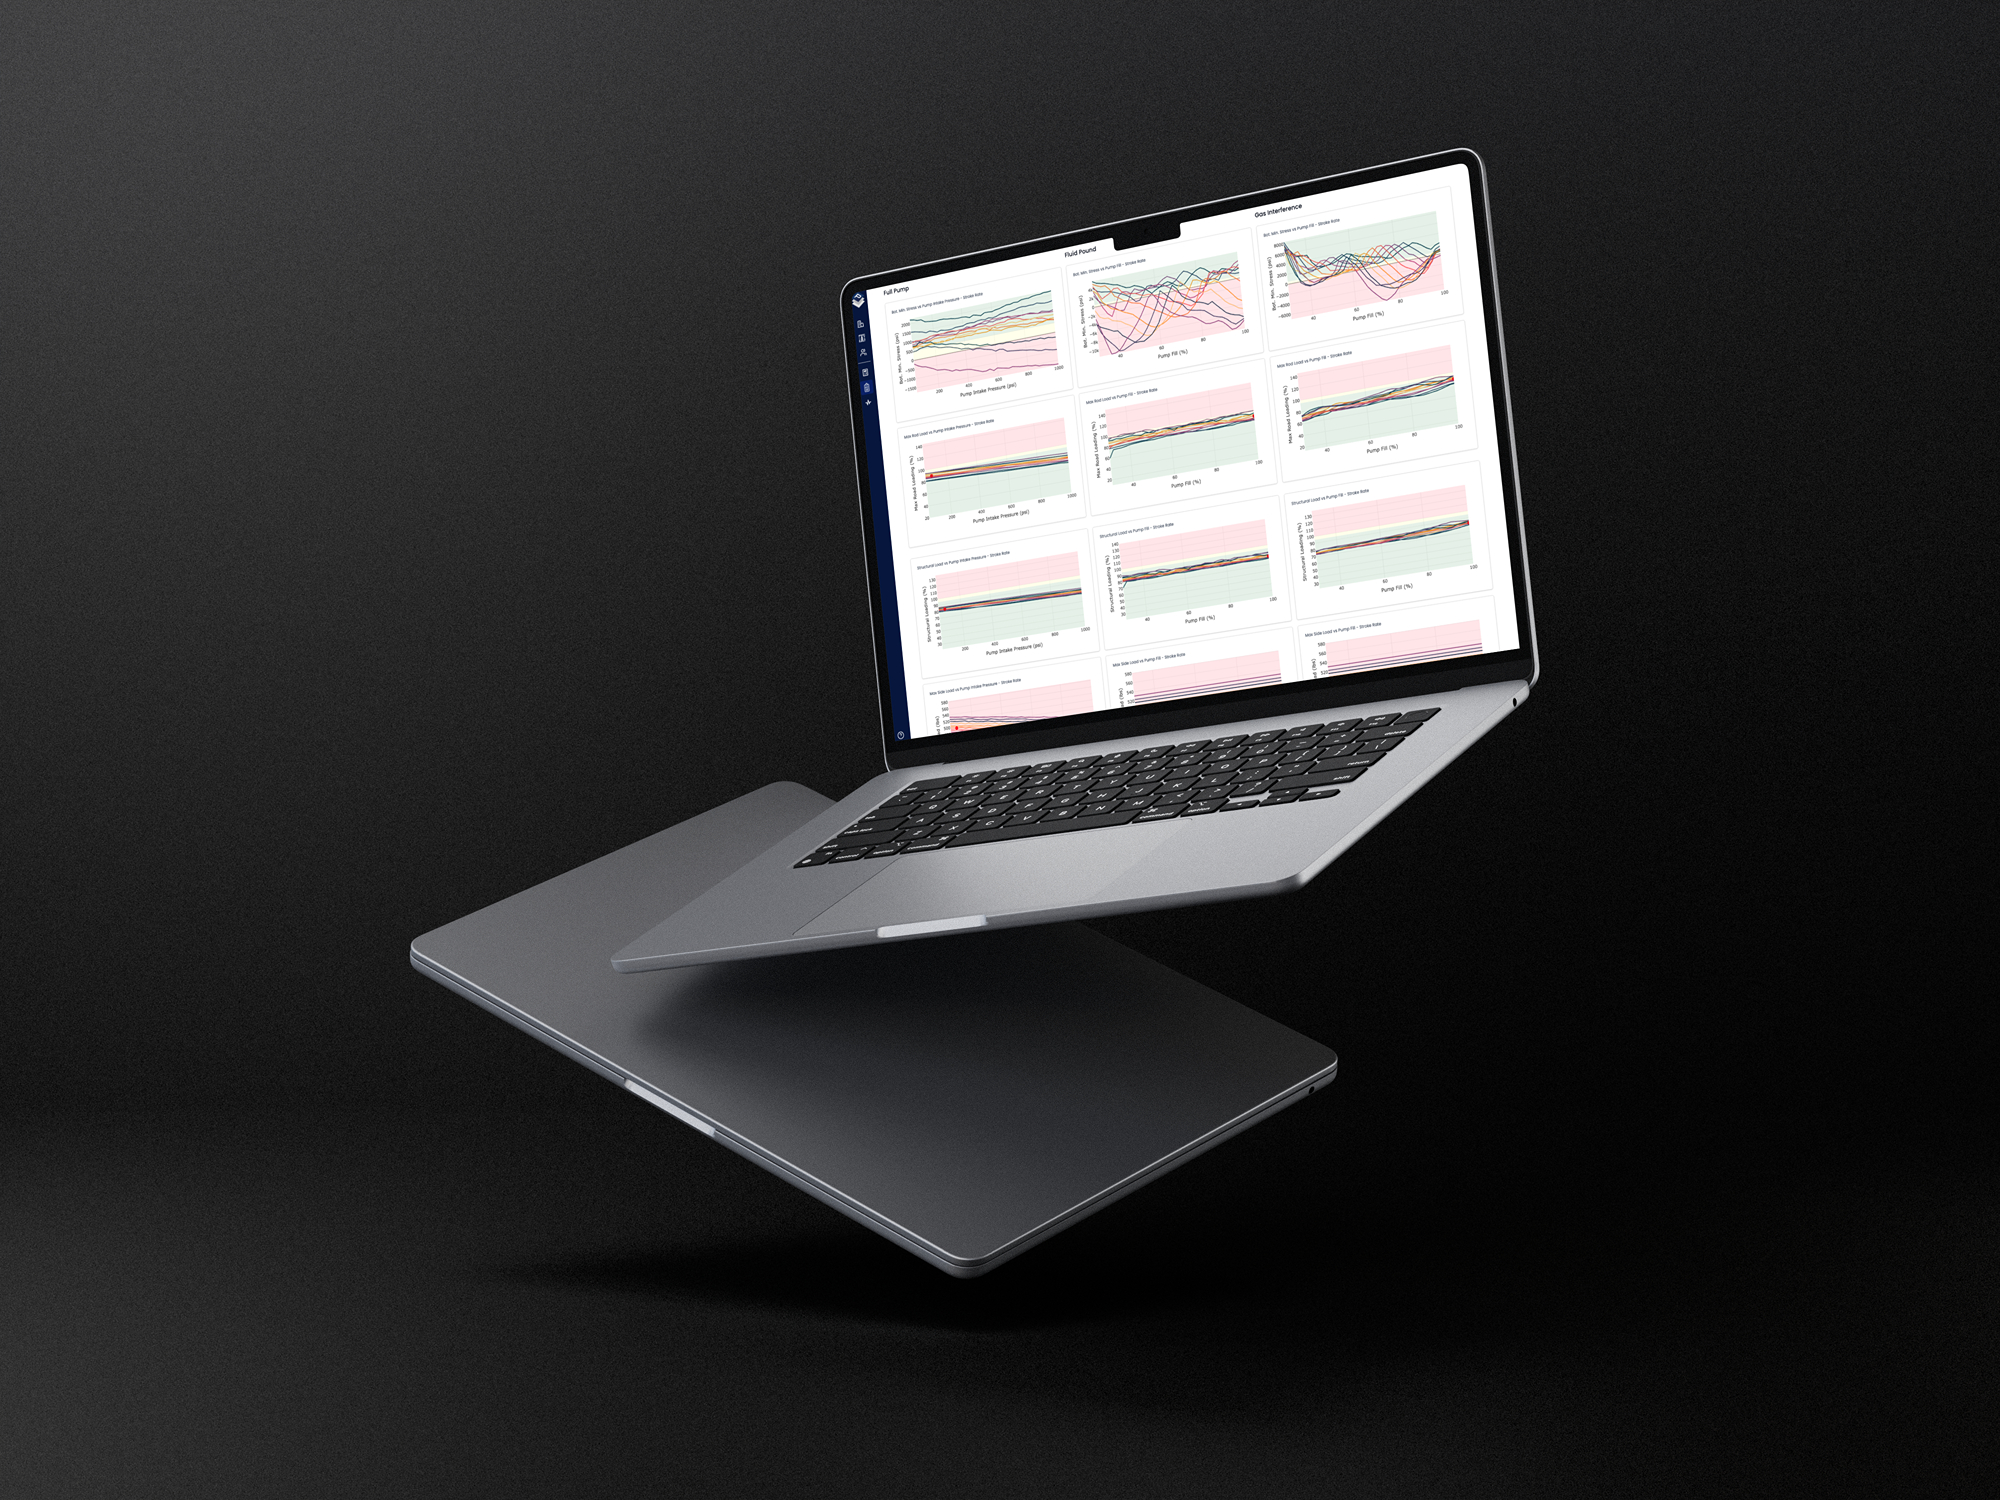
RodSim Dynamics is an advanced simulation tool leveraging parallel processing to automatically model changing wellbore sensitivities. A tedious manual process now done in seconds.
Performance Modeling at Scale
RodSim Dynamics transforms static rod design by running thousands of simulated variations that account for changing wellbore conditions throughout the well's lifecycle.
Simulates Varying Conditions
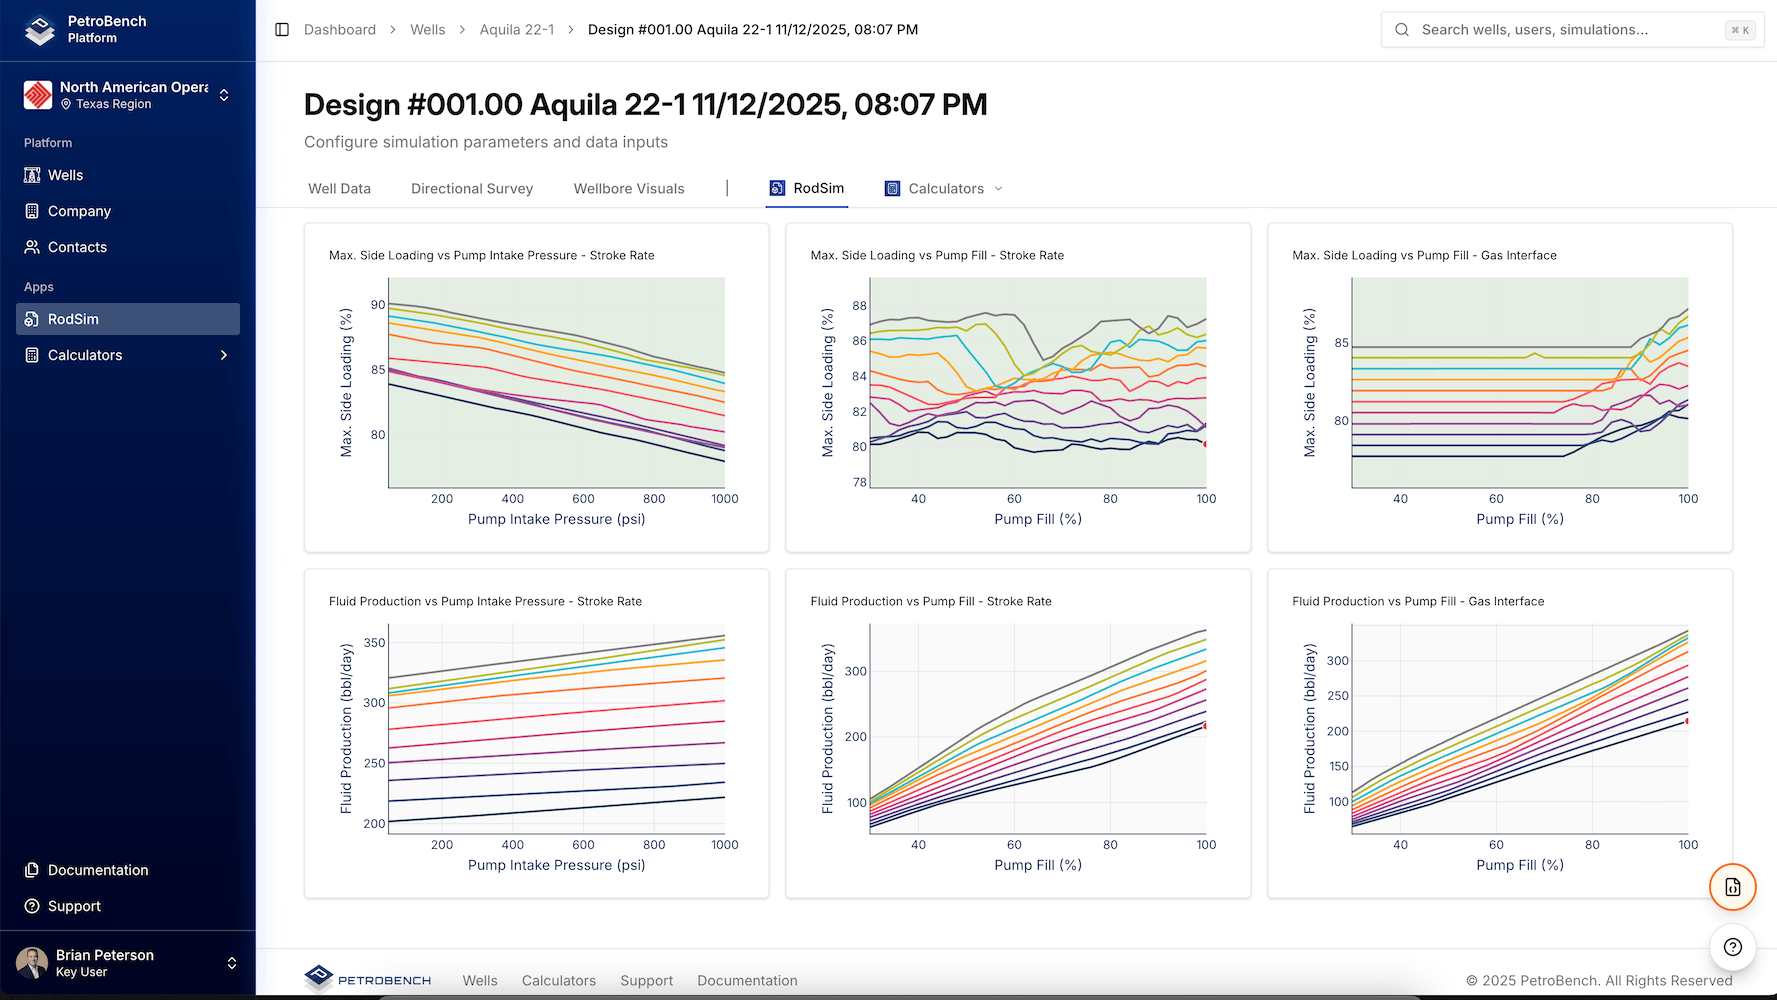
Model a range of wellbore conditions from fluctuating pump fill levels and pump intake pressure to varying stroke rates, providing a realistic view of how the rod-pumping system performs across different scenarios.
1,200+ Parallel Simulations
Advanced cloud computing runs 1,200+ simulations simultaneously, rapidly analyzing multiple configurations and conditions. Parallel processing saves time and enables faster data-driven decisions.
18 Dynamic Graphs
Visualize key metrics including bottom minimum stress, road loading, and other equipment performance indicators. Dynamic graphs provide clear, detailed views of how each parameter changes over time, making it easier to monitor performance.
Lifecycle Optimization
Analyze dynamic well conditions and adjust designs to optimize the entire lifecycle of rod-pumping systems. Fine-tune simulations to improve efficiency, extend rod lifespan, and ensure consistent production.
Performance Modeling for Rod-Pump Systems
All oil wells change over time, and those changes have an impact on the suitability of the pumping unit and rods. RodSim Dynamics provides a way to easily simulate how those changes in wellbore conditions will impact your pumping system and help you produce a design that will stand the test of time.
Bulk Simulations
Customizable Output Graphs
Provide comprehensive visualizations of force profiles across a wide range of wellbore conditions.
Tailored Parameter Displays
Enable users to focus on the data most relevant to their specific analysis requirements.
Accessible Data Visualization
Helps identify patterns, assess potential risks, and develop effective solutions for rod string integrity.
Parallel Simulation Workflow
RodSim Dynamics analyzes wellbore conditions including fluid levels, pressure changes, and stroke rates through advanced parallel processing.
4-Step Analysis Process
1. Import Well Data
Load deviation surveys, fluid levels, and production history directly from Excel or legacy tools
2. Configure Variables
Define 25+ parameters including pump specs, fluid properties, and operational constraints
3. Cloud Processing
Execute multiple simulations in parallel using cloud infrastructure for faster processing
4. Optimize Design
Generate 15 dynamic graphs with actionable optimization insights
Core Sensitivities
Pump Fillage
Optimal pump submergence across varying fluid levels
Pump Intake Pressure
See how your design performs as you pump your well down
Stroke Rate Optimization
Ideal pumping speed for maximum efficiency
Advanced Performance Visualization
Real-time graphs displaying pump performance, rod loading, and optimization metrics update instantly as you adjust parameters.
Pump Performance
Analyze pump intake pressures, fill rates, and submergence including full pump conditions and fluid pound effects.
Rod Loading
Monitor rod stress distribution, fatigue life, and critical loading to prevent failures.
Gas Interference
Optimize stroke rates and velocity profiles while accounting for gas interference effects on pump performance.
Advanced Cloud Computing
Cloud infrastructure delivers enhanced parallel processing power for complex wellbore analysis calculations.
Performance Gains
Days → Minutes
Complete analysis in minutes vs lengthy desktop runs
Unlimited Scale
Auto-scaling for enterprise workloads
Parallel Processing
Cloud infrastructure delivers enhanced parallel processing power
Performance Comparison

Experience RodSim Dynamics
See how parallel simulation processing transforms wellbore analysis. Schedule a demonstration to experience real-time dynamic modeling with your actual well configurations.
Our scheduling system is temporarily unavailable. Click below to schedule directly or contact us.
Have questions or need help with something else? Get in touch